How To Troubleshoot Lag Using Spark
Spark is a performance profiling tool for Spigot/Paper that can help you identify points of lag on your server. In this guide we are going to cover how you can install and use Spark to try and pinpoint a source of lag on your Minecraft server.
Installing Spark
Open your Dashboard.
Locate your Minecraft server and click on the Panel button.
Once on your Minecraft server, click on the Plugins tab.
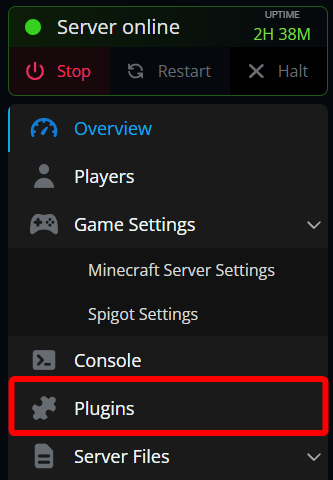
Click on Search then use the search box to search for Spark.
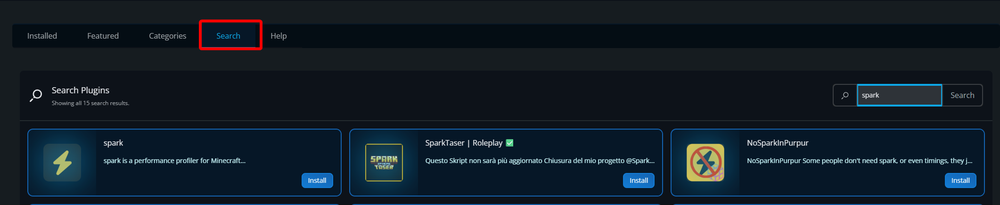
Once you find Spark, click on Install.

Once the install is finished, you can restart your server to load the plugin.
Generating a Report With Spark
Return to your Panel and open your console or join your server.
Run the command /spark profiler open which will generate you a link to open in your browser to view the live report.


When your server starts it automatically starts generating a report from the moment it started. If the lag starts to occur right after starting up can just open the report immediately. If your server has been online for a while before your lag started to occur it’s recommended to restart the profiler to get a more focused reading. To do this, just type /spark profiler stop followed by /spark profiler start either in your console or as an OP in-game. You can then run /spark profiler open view the current stats. It can take a few minutes for data to populate.
Key Things to Look For
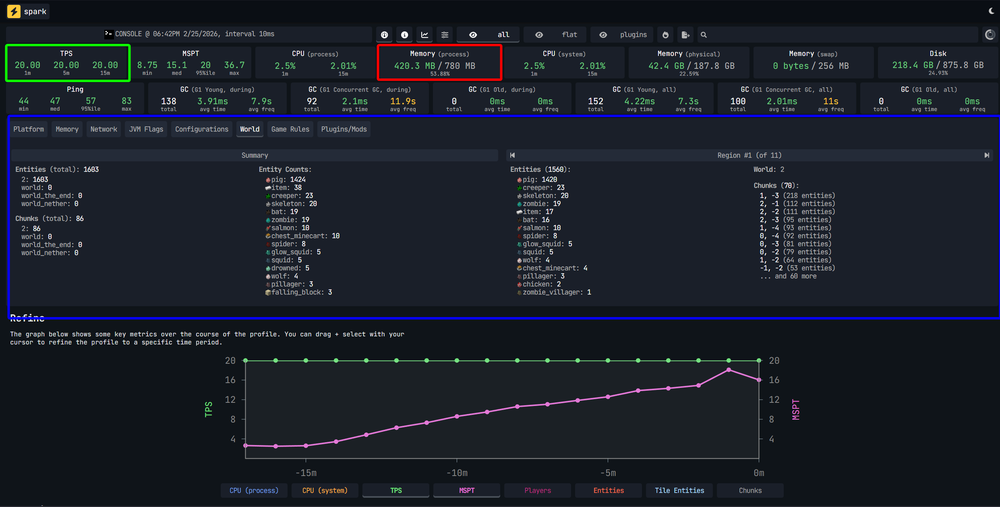
In your report there are a few things you want to take a look at. You will want to check how much RAM/Memory you are using and have free, what your TPS is, and if you have a large number of entities in the world. If you are running out of RAM/Memory your server can definitely lag or even crash. If you are using plugins you may need to remove some plugins or consider upgrading your plan.
As for your TPS, generally if it’s above 18 you should not see any negative effect on your server. If your TPS is low it could be caused by a single issue or a combination of things such as a lot of entities, too many plugins/words/players and/or low RAM. Finally, entities, if you have too many entities such as mobs, those can be a large load on your server. In the following example you can see that the memory and TPS are actually at good levels however there is a large number of pigs spawned by one or more players. While this is not affecting the server it could negatively impact FPS for nearby players which could be perceived as lag on a server.
To fully go through this report, we highly recommend checking out the official documentation which can be found here.
Need Help?
If you have questions or run into any issues, our support team is here to help! Reach out using the support widget on our website or visit our support center for further assistance.